

Wait, you can use ALL of Grafana Cloud's AI features for free?!
Yes! Here's exactly how — and the one thing you should know before you do it.
Search for a command to run...
Yes! Here's exactly how — and the one thing you should know before you do it.
No comments yet. Be the first to comment.
How static thresholds create alert fatigue — and what actually fixes it.
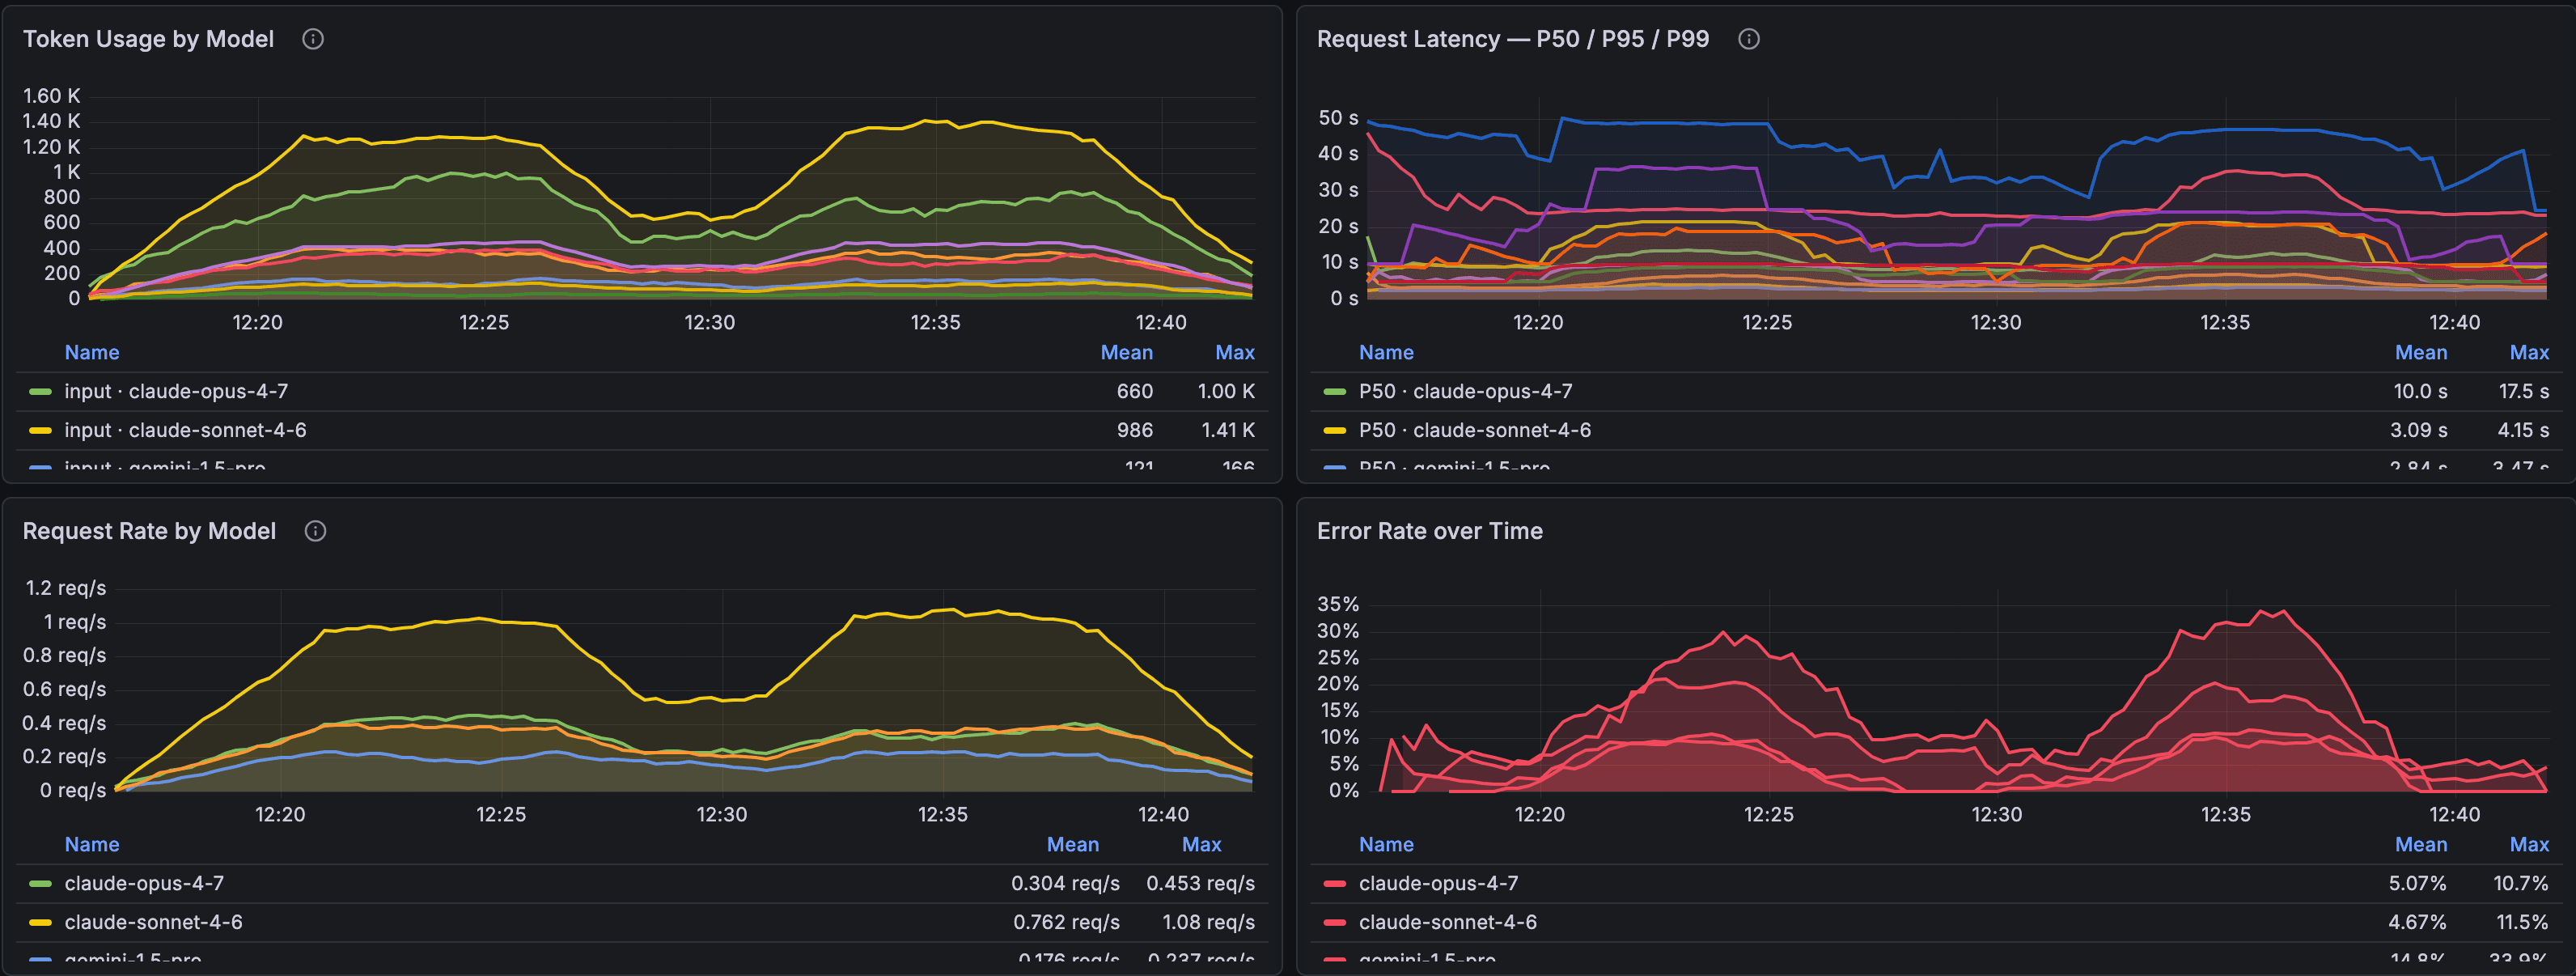
You shipped the agent. It works. Users are happy. Somewhere in the background, tokens are flowing, latency is creeping, and your API bill is doing things you haven't looked at closely enough. We've se
In modern observability, capturing and storing every trace can quickly become impractical due to storage costs and noise from less relevant data. Tail sampling is a powerful technique that enables smarter trace retention by evaluating full traces bef...

As observability becomes a cornerstone of modern infrastructure, organizations are turning to platforms like Grafana Cloud and Datadog to monitor logs, metrics, and traces. However, these tools often come with hidden complexities, not just in their f...

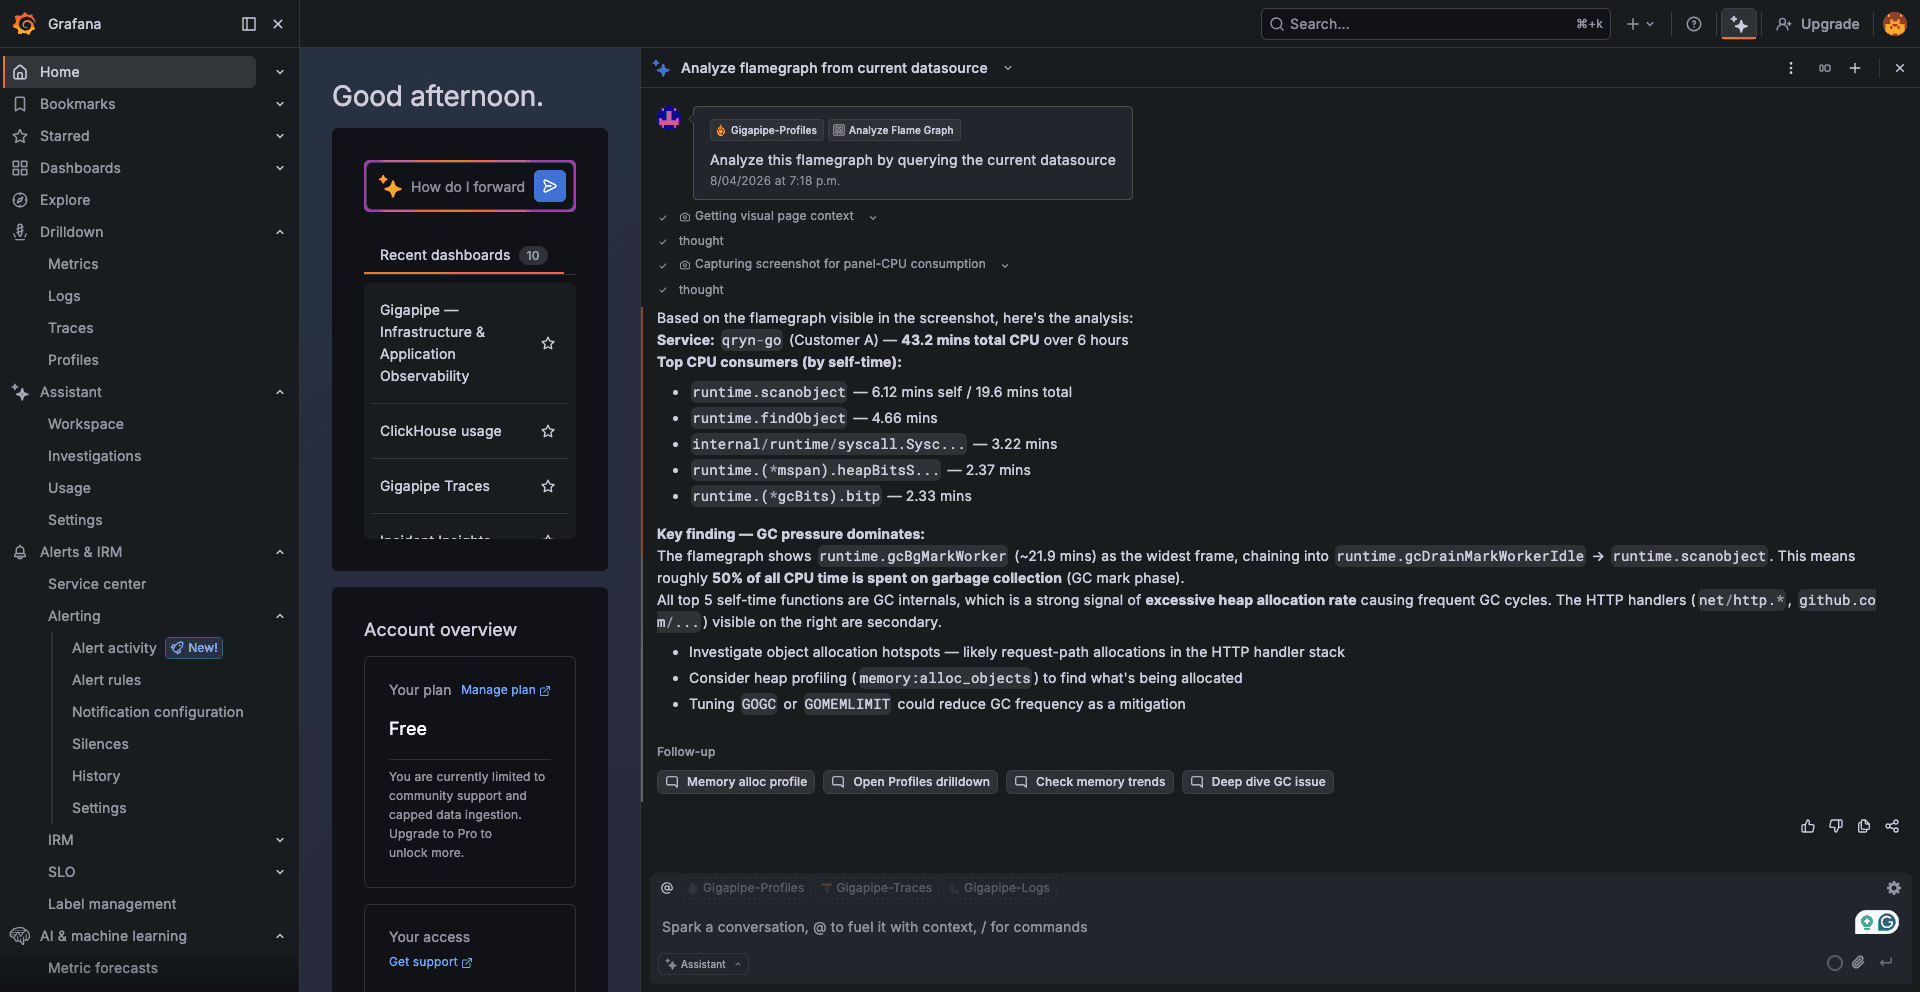
A couple of months ago, I was testing Grafana Cloud AI features. Natural language querying, automated investigation, the Assistant — all of it. It started as a silly test, I thought it wouldn't work... So when it did, it almost felt too good to be true. So I decided to share it!
I was using all of it for free. Not a trial. Not a degraded version. Everything Grafana Cloud offers on the AI side, fully working, against my own production data.
Let me explain how that's possible — because once you understand the mechanics, it makes complete sense. And it might change how you think about your observability stack. 💰
When people think "Grafana Cloud free tier," they think "limited." And it is limited. But the limits are specifically on storage: how many active metrics series you can keep, how many logs, traces and profiles. Basically: Retention period. That's where the ceiling is.
The AI features aren't behind that ceiling.
Grafana Cloud AI features work against your connected datasources — not just data stored in Grafana's own backend. If you point a free Grafana Cloud account at an external Prometheus datasource, the AI can query it. The natural language querying works. The investigation feature works. The Assistant works.
So the question becomes: what's your external datasource?
Gigapipe is a polyglot observability backend, wire compatible with Prometheus, Loki, Tempo, Pyroscope and more, all in one place, fully compatible with Grafana. You can run it yourself (open-source) or use Gigapipe Cloud.
When you connect a free Grafana Cloud account to Gigapipe as the datasource, something interesting happens. Your data lives in Gigapipe. Grafana's storage limits? Irrelevant — you're not using Grafana's storage. But the Grafana Cloud AI features? Fully available, because they work against the datasource, not the storage tier.
You end up with:
Your metrics, logs, profiles and traces stored and managed in Gigapipe
A free Grafana Cloud account as the frontend and AI layer
Access to all Grafana Cloud AI features — natural language querying, automated investigation, the Assistant — at zero additional cost on the Grafana side
I've tested this end-to-end. It works.

Instead of writing a PromQL query to find the cause of a spike, you ask: "What changed in the last hour that could explain the increase in error rate for the checkout service?" The Assistant goes through your metrics, correlates what it finds, and gives you an answer.
Instead of manually clicking through dashboards during an incident, the investigation feature automatically surfaces the metrics and logs most relevant to what's going wrong — from your data, in your Gigapipe instance.
Instead of knowing PromQL to explore a new metric, you describe what you're looking for in plain language and get a working query back.
These are not toy features. These are the features Grafana has been building as the premium tier of their cloud product. And you get them because your data is in Gigapipe, not because you're paying Grafana for storage.
When you use Grafana Cloud AI features against your data, that data goes to Grafana's AI infrastructure for processing. The query, the relevant metrics, and the context — it leaves Gigapipe and goes to Grafana for the AI to work on it.
For a lot of teams, that's completely fine. If you're not under strict data governance requirements and you're focused on getting the most powerful tooling at the lowest cost, this trade-off is absolutely worth it.
But if your team can't have production data leave your perimeter — compliance, security policy, customer contractual obligations — then this approach isn't for you.
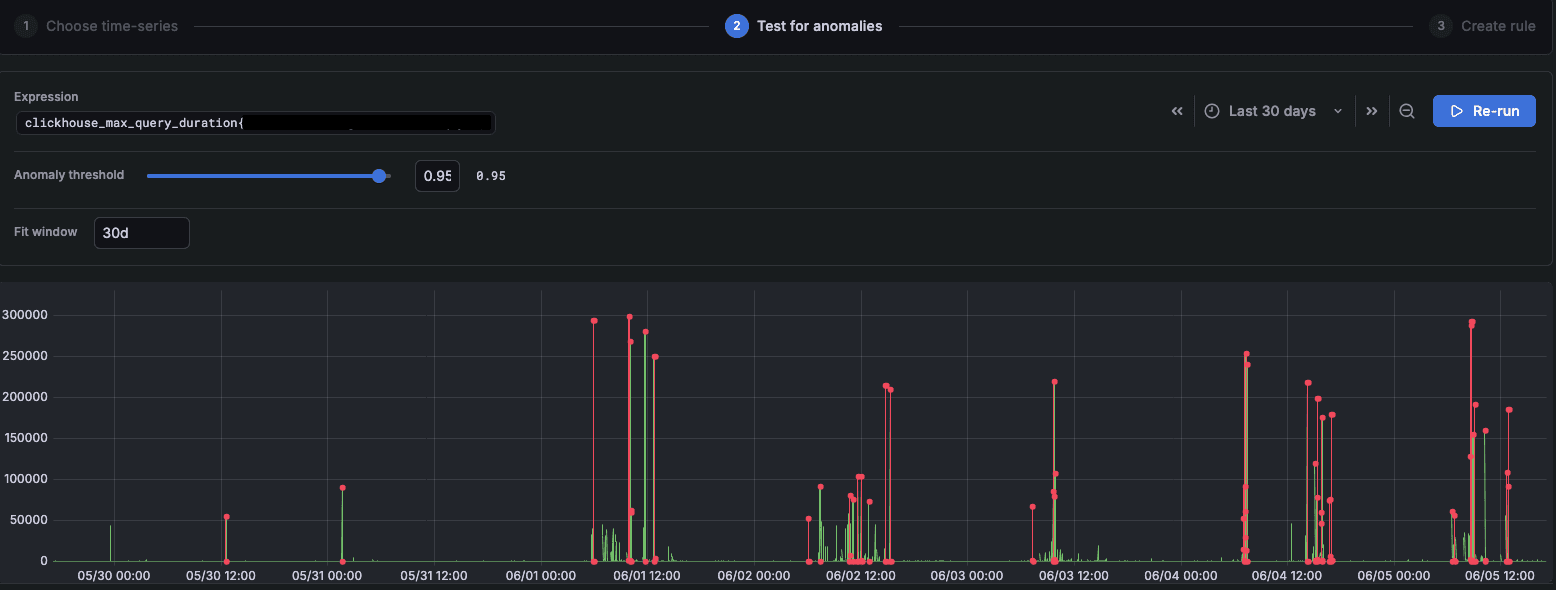
In that case, Gigapipe's native Anomaly Detection is the right path: the model runs fully within Gigapipe's infrastructure, your data never goes anywhere. To know more about, check this blog post.
Two different requirements, two different answers. Neither is wrong. It just depends on what matters most to your team.
This works for:
Teams running Gigapipe open-source who want access to AI-powered observability without adding another paid product
Gigapipe Cloud users who want to layer Grafana's AI features on top without a Grafana bill
Teams where data governance isn't a hard constraint and cost efficiency is the priority
It's not for:
Teams with compliance or contractual requirements around data leaving their environment
Teams that need AI fully within their own perimeter (use Gigapipe's native Anomaly Detection instead)
What you need:
Gigapipe. Either the open-source or the cloud version. Both work.
A free Grafana Cloud account (grafana.com, the free tier is enough)
Add your Gigapipe Prometheus/Loki/Pyroscope/Tempo endpoint(s) as a data source in Grafana Cloud

And that's it! From there, all the Grafana AI features are available in the Grafana Cloud UI.
You can start with the Assistant — ask it a question about your data and see what comes back. Then you have the incident investigation, anomaly detection, and all that Grafana AI has to offer... For free.
Gigapipe is a polyglot observability platform built on open standards.
Your data, your stack, no vendor lock-ins.