
🤖 Your AI Agent Is Burning Money. You Just Can't See It Yet.

You shipped the agent. It works. Users are happy. Somewhere in the background, tokens are flowing, latency is creeping, and your API bill is doing things you haven't looked at closely enough.
We've seen it firsthand: a retry loop nobody noticed was responsible for 30% of monthly token spend. A model fallback quietly kicking in on failures, routing to a slower, pricier model. A multi-step agent stalling at step 3 every time — not erroring, just slow. None of it visible in logs. All of it visible in traces.
Here's the thing most teams don't know: every major AI agent framework already speaks OpenTelemetry. Some ship with it built in — zero extra code, just environment variables. The only missing piece is somewhere to send the data.
That's what Gigapipe is for. One pipeline addition to the collector that already ships with your stack, and every agent you run — regardless of framework — starts sending traces, metrics, and logs to the same Grafana you already use for infrastructure.
Let's wire it up.
⭐ What You Get
Full observability on your AI agents — without a new SaaS tool, without a new bill:
Token usage — input and output per request, per model, per agent
Latency — P50/P95/P99 from your LLM provider, in real time
Cost signals — token counts turned into dollar estimates, right in Grafana
Error rates — failed calls, rate limits, timeouts — all surfaced
Distributed traces — the full call chain for multi-step agents, every step visible
Everything lands in Gigapipe. One backend. Every framework. And for several SDKs — including the Claude Code Agent SDK — there's no instrumentation code to write at all.
⚙️ How It Flows

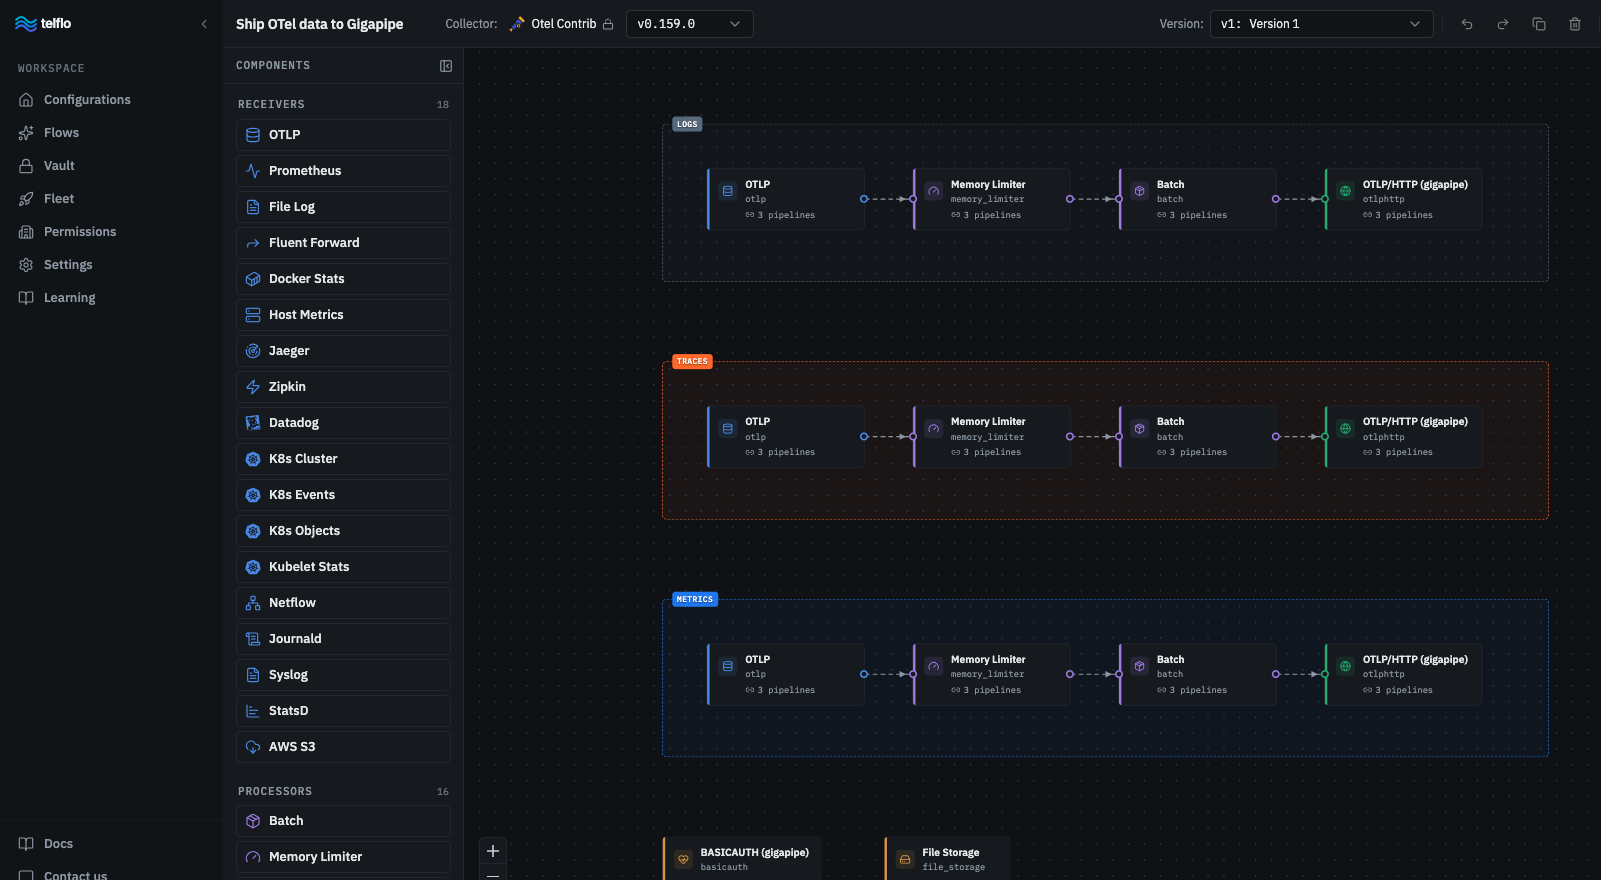
The OTel Collector is the single ingestion point. Your agent sends OTLP to it, the collector forwards to Gigapipe. One config file, three pipelines.
🔧 Step 1 — Set Up the Collector
If you don't have an OTel Collector yet, the fastest way is Docker:
docker run -d --name otel-collector \
  -p 4317:4317 -p 4318:4318 \
  -v $(pwd)/collector-config.yaml:/etc/otel/config.yaml \
  otel/opentelemetry-collector-contrib:latest \
  --config /etc/otel/config.yaml
Create collector-config.yaml:
receivers:
  otlp:
    protocols:
      grpc:
        endpoint: 0.0.0.0:4317
      http:
        endpoint: 0.0.0.0:4318   # most SDKs default to HTTP

processors:
  batch:

exporters:
  prometheusremotewrite:
    endpoint: "${GIGAPIPE_REMOTE_WRITE_ENDPOINT}"
    timeout: 30s

  otlphttp/gigapipe_traces:
    endpoint: "${GIGAPIPE_OTLP_ENDPOINT}"
    tls:
      insecure: false

  loki:
    endpoint: "${GIGAPIPE_LOKI_ENDPOINT}"

service:
  pipelines:
    metrics:
      receivers: [otlp]
      processors: [batch]
      exporters: [prometheusremotewrite]

    traces:
      receivers: [otlp]
      processors: [batch]
      exporters: [otlphttp/gigapipe_traces]

    logs:
      receivers: [otlp]
      processors: [batch]
      exporters: [loki]
Your Gigapipe endpoints and credentials are in your Gigapipe dashboard under Settings → Integrations. Set them as environment variables or substitute directly.
Already have a collector running? Just add the
otlpreceiver (both protocols) and the three pipelines above — don't replace your existing config, merge with it.
Restart the collector after any config change:
docker compose restart otel-collector
Infrastructure side: done. ✅
💦 Step 2 — Instrument Your Agent
All examples below are for applications you write and run programmatically. These are SDKs and libraries you call from your own code — a Python script, a backend service, an automation pipeline. If you're using an AI tool interactively (Claude CLI, GitHub Copilot in your IDE), this section doesn't apply to that usage. The observability story here is about the agents and pipelines you build.
Pick your framework. The collector endpoint is always the same.
Claude Code Agent SDK
No packages. No instrumentation code. Just environment variables.
The Claude Code Agent SDK runs the Claude Code CLI as a subprocess, and the CLI ships with full OpenTelemetry instrumentation built in — traces, metrics, and structured logs. You tell it where to send data. That's the entire setup.
import asyncio
from claude_agent_sdk import query, ClaudeAgentOptions

OTEL_ENV = {
    "CLAUDE_CODE_ENABLE_TELEMETRY": "1",
    "CLAUDE_CODE_ENHANCED_TELEMETRY_BETA": "1",  # enables traces
    "OTEL_TRACES_EXPORTER": "otlp",
    "OTEL_METRICS_EXPORTER": "otlp",
    "OTEL_LOGS_EXPORTER": "otlp",
    "OTEL_EXPORTER_OTLP_PROTOCOL": "http/protobuf",
    "OTEL_EXPORTER_OTLP_ENDPOINT": "http://<YOUR_COLLECTOR_HOST>:4318",
    "OTEL_SERVICE_NAME": "my-claude-agent",
    # Optional: shorten flush intervals for short-lived tasks
    "OTEL_METRIC_EXPORT_INTERVAL": "5000",
    "OTEL_TRACES_EXPORT_INTERVAL": "5000",
    "OTEL_LOGS_EXPORT_INTERVAL": "5000",
}

async def main():
    options = ClaudeAgentOptions(env=OTEL_ENV)
    async for message in query(prompt="Summarise the repo", options=options):
        print(message)

asyncio.run(main())
What lands in Gigapipe per agent run:
| Span | What it contains |
|---|---|
claude_code.interaction |
Full turn — prompt in, response out |
claude_code.llm_request |
Model name, token counts, latency per API call |
claude_code.tool |
Every tool invocation with timing |
claude_code.tool.execution |
The actual tool run, isolated |
When your agent spawns subagents via the Task tool, their spans nest automatically under the parent trace. The full delegation chain appears as one timeline in Tempo — no extra config needed.
You can also tag each run with end-user identity for multi-tenant setups:
from urllib.parse import quote

options = ClaudeAgentOptions(
    env={
        **OTEL_ENV,
        "OTEL_RESOURCE_ATTRIBUTES": f"enduser.id={quote(user_id)},tenant.id={quote(tenant_id)}",
    }
)
Claude / Anthropic SDK (Python)
For agents built directly against the Anthropic API — not the Agent SDK:
pip install opentelemetry-instrumentation-anthropic \
            opentelemetry-exporter-otlp-proto-grpc
Add this before importing anthropic:
from opentelemetry import trace
from opentelemetry.sdk.trace import TracerProvider
from opentelemetry.sdk.trace.export import BatchSpanProcessor
from opentelemetry.exporter.otlp.proto.grpc.trace_exporter import OTLPSpanExporter
from opentelemetry.instrumentation.anthropic import AnthropicInstrumentor

provider = TracerProvider()
provider.add_span_processor(
    BatchSpanProcessor(OTLPSpanExporter(endpoint="http://<YOUR_COLLECTOR_HOST>:4317"))
)
trace.set_tracer_provider(provider)
AnthropicInstrumentor().instrument()

import anthropic
client = anthropic.Anthropic()
Every client.messages.create() now emits a span — model, token counts, duration, errors. Automatically.
LangChain / LangGraph
pip install opentelemetry-instrumentation-langchain \
            opentelemetry-exporter-otlp-proto-grpc
from opentelemetry.instrumentation.langchain import LangChainInstrumentor

# Same OTel provider setup as above, then:
LangChainInstrumentor().instrument()

# Works with any LangChain-supported model
from langchain_openai import ChatOpenAI       # or langchain_anthropic, langchain_google, etc.
llm = ChatOpenAI(model="gpt-4o")
LangGraph nodes each become a child span. Multi-step reasoning becomes a readable trace instead of a black box.
OpenAI Agents SDK
pip install opentelemetry-instrumentation-openai \
            opentelemetry-exporter-otlp-proto-grpc
from opentelemetry.instrumentation.openai import OpenAIInstrumentor
OpenAIInstrumentor().instrument()
Or go completely zero-code:
OTEL_EXPORTER_OTLP_ENDPOINT=http://<YOUR_COLLECTOR_HOST>:4317 \
OTEL_SERVICE_NAME=my-agent \
opentelemetry-instrument python agent.py
GitHub Copilot SDK
TypeScript-first. This is the programmatic SDK for building Copilot-powered extensions and agents — not the IDE plugin. Traces over OTLP HTTP, same collector port.
import { CopilotClient } from "@github/copilot-sdk";

const client = new CopilotClient({
  telemetry: {
    otlpEndpoint: "http://<YOUR_COLLECTOR_HOST>:4318",
    exporterType: "otlp-http",
    captureContent: true,
  },
});
W3C trace context is propagated across SDK boundaries — wrap a Copilot call inside your own span and it nests correctly in Tempo.
⚠️ All frameworks follow the OpenTelemetry Gen AI semantic conventions — same attribute names (
gen_ai.system,gen_ai.request.model,gen_ai.usage.input_tokens) regardless of provider. One Grafana dashboard covers all of them.
📊 Step 3 — Grafana Panels That Actually Tell You Something


Use the Tempo data source for traces and Prometheus for derived metrics.
Token usage by model
sum by (gen_ai_request_model) (
  rate(gen_ai_usage_input_tokens_total[5m])
)

P95 latency per model
histogram_quantile(0.95,
  sum by (le, gen_ai_request_model) (
    rate(gen_ai_client_operation_duration_seconds_bucket[5m])
  )
)

Error rate
sum(rate(gen_ai_client_operation_duration_seconds_count{error="true"}[5m]))
/
sum(rate(gen_ai_client_operation_duration_seconds_count[5m]))
⚠️ The
error="true"label is emitted by SDKs that attach it as a metric attribute. If your SDK records errors only on spans (viaerror.type), use the Tempo data source to filter errored traces instead.

Hourly cost estimate (adjust coefficients to your model pricing):
(
  sum(rate(gen_ai_usage_input_tokens_total[1h])) * 0.000003
  +
  sum(rate(gen_ai_usage_output_tokens_total[1h])) * 0.000015
) * 3600
For trace exploration: switch to the Tempo panel, filter by service.name to isolate a specific agent, or by gen_ai.system=anthropic to scope to a provider. If you're running the Claude Code Agent SDK, drill into claude_code.llm_request spans — that's where model name, token counts, and latency live per call.
📥 Don't want to build the panels manually? Grab the pre-built dashboard: Import from GitHub — download the JSON and import it to your Grafana via Dashboards → Import → Upload JSON file.
🐙 What Agents Work With This
| Framework | Signals | How |
|---|---|---|
| Claude Code Agent SDK | Traces + Metrics + Logs | Built-in — env vars only. Subagent nesting automatic |
| GitHub Copilot SDK | Traces | Config object, OTLP HTTP. W3C context propagation |
| Anthropic SDK | Traces | opentelemetry-instrumentation-anthropic |
| LangChain / LangGraph | Traces | opentelemetry-instrumentation-langchain. Graph nodes as child spans |
| OpenAI Agents SDK | Traces | opentelemetry-instrumentation-openai. Tool calls included |
| Haystack | Traces | opentelemetry-instrumentation-haystack. Pipeline components as spans |
| LlamaIndex | Traces | openinference-instrumentation-llama-index via Arize OpenInference |
| CrewAI | Traces | opentelemetry-instrumentation-crewai. Agent/task hierarchy visible |
🔶 Running Gigapipe OSS?
Self-hosted users — everything above applies. Three things to confirm:
Ports
4317(gRPC) and4318(HTTP) on the collector are reachable from your agent hostsQRYN_OTLP_ENDPOINTis set in your env file pointing at your Gigapipe instanceTempo data source in Grafana points at
http://giga-qryn-reader:3200
Not running Gigapipe yet? The quickstart gets you the full OTel-ready stack in under 10 minutes.
What You Actually Gain
TLDR: Observability 👀
Token budgets stop being a black box. That retry loop quietly burning through your token quota shows up as a spike in the metrics panel. The model fallback routing to a pricier model on errors becomes visible in the traces. The agent that stalls at step 3 — not erroring, just slow — has a tool execution span sitting there with the answer.
Switch frameworks next quarter? The dashboard doesn't change. Add a second agent in a different language? Same collector, same queries, same Grafana. That's what a proper observability foundation looks like.
AI agents are infrastructure now. Treat them like it.
Questions? Share your dashboard setup in our community or ping us on Element (matrix room).