
Your Monitoring Thinks 3 AM Looks Like 3 PM. That's Why You Miss Incidents.
How static thresholds create alert fatigue — and what actually fixes it.
Let me start with a question. How many alert rules do you have right now that you honestly trust?
If the answer made you pause, you're not alone. Most teams I talk to are in the same situation: they have dashboards, they have Grafana, they have alert rules — and they still find out about problems from a customer email. Not from their monitoring.
So what's going on?
The problem isn't your alerting stack. It's not even your thresholds. The problem is that a static threshold can't know what "normal" looks like for your specific metric, at this specific time of day, on this specific day of the week. It just compares a number to a line you drew at some point in the past and hoped would still make sense.
And it doesn't. Not really.
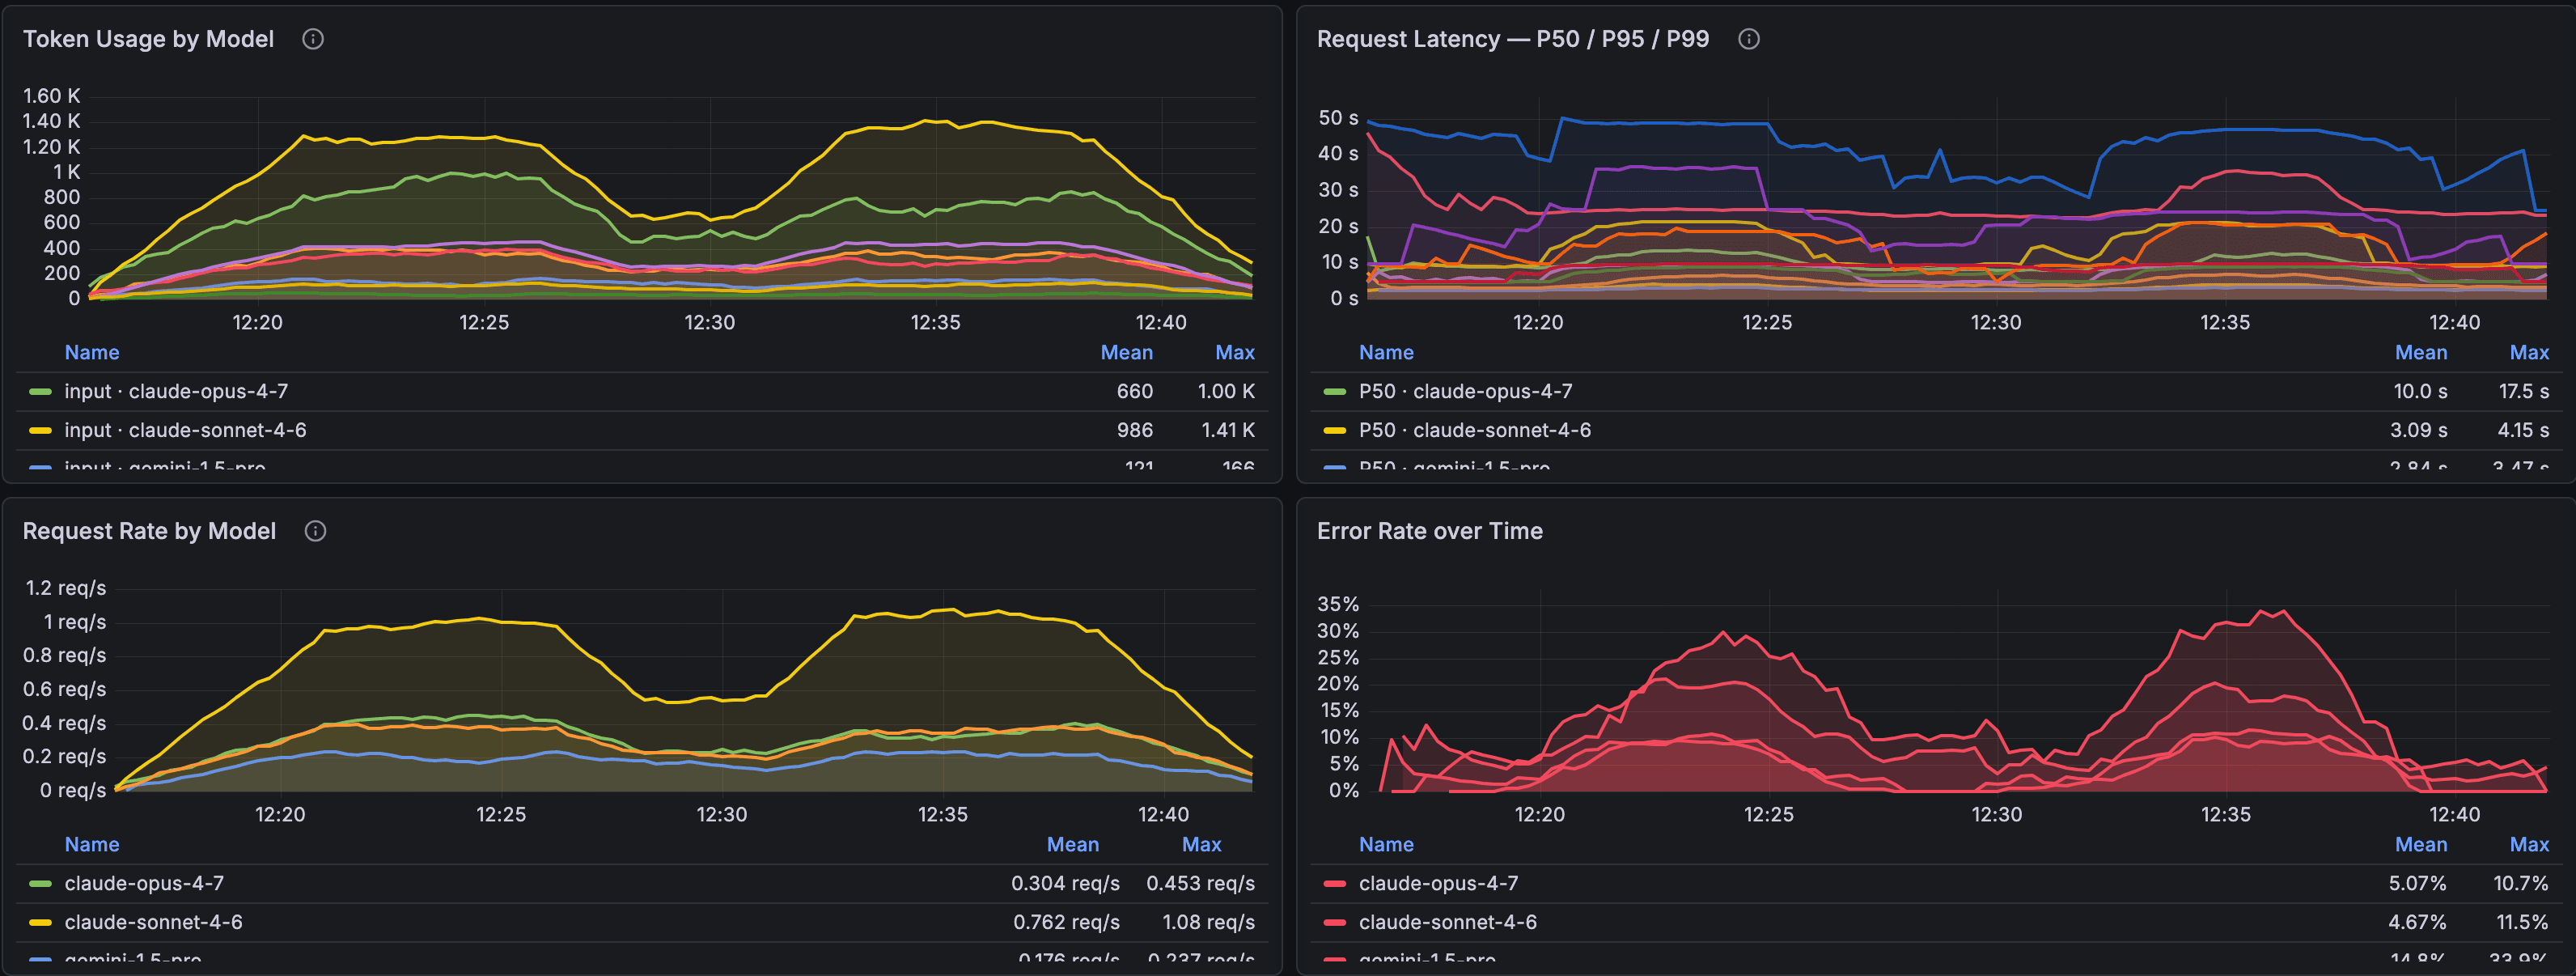
A request rate of 280 req/s at 3 AM is healthy. The same 280 req/s at 11 AM on a Tuesday, when you normally see 1,200? That's an incident nobody paged you about.
⚙️ So what does actually work?
The idea is straightforward: instead of asking "is this metric above X?", you ask "is this metric behaving unusually compared to how it normally behaves?"
Those are very different questions.
When your monitoring can answer the second one, a lot of things start making sense. Traffic that drops 40% on a Sunday morning is background noise — your system knows Sundays are quiet. The same drop on a Tuesday at peak hours is immediately suspicious. Memory creeping up slowly over three weeks is a trend, not a crisis. A metric that's been rock-solid for a month and suddenly starts moving gets flagged before it crosses any threshold you'd have thought to set.
Fewer pages. The pages that do come through are real. Your on-call team starts trusting the alerts again. That last one is honestly underrated.
⭐ How Gigapipe's anomaly detection works under the hood
When you point it at a metric, it trains a forecasting model on your historical data — 30 days by default. The model picks up three things automatically:
Daily patterns. Your traffic peaks at noon, drops overnight, and batch jobs run at 4 AM. It learns all of that.
Weekly patterns. Quieter weekends, busier weekday mornings. Learned.
Long-term trends. Your user base grew 20% over the past six weeks. The model adjusts its baseline, so gradual growth doesn't keep triggering anomaly flags.
For every data point, it produces a forecast value and a confidence band — basically, the expected range of normal. Then it scores each incoming point from 0 to 1:
| Score | What it means |
|---|---|
| 0.0 – 0.5 | Normal. Right where the model expected. |
| 0.5 – 0.8 | Mild deviation. Worth watching. |
| 0.8 – 0.95 | Notable deviation. Near the edge of expected behaviour. |
| 0.95 – 1.0 | Strong anomaly. At or beyond the confidence band. Investigate. |
One thing I find clever about the design: the confidence band adapts to each metric individually. A noisy, spiky metric gets a wider band — moderate swings don't trigger it. A stable metric gets a narrow band — even small deviations score high. It's not comparing your error rate to some generic benchmark. It's comparing it to your error rate's own history.
🔧 Getting started: it's three steps
This runs as a plugin directly inside your Gigapipe Grafana instance. Nothing to install separately, no new infrastructure. Enable Anomaly PLG once under Administration → Plugins, in the sidebar menu.
Step 1 — Pick what you want to monitor
Select your Prometheus datasource, pick a metric, and add label filters if you want to narrow it down to a specific service, environment, or host. The PromQL selector builds as you go.
request_rate{env="prod", service="checkout"}
The more specific the series, the better the model's baseline. A model trained on a whole environment learns aggregate patterns. A model trained on a specific service learns that service's behaviour. Both are useful — they just answer different questions.
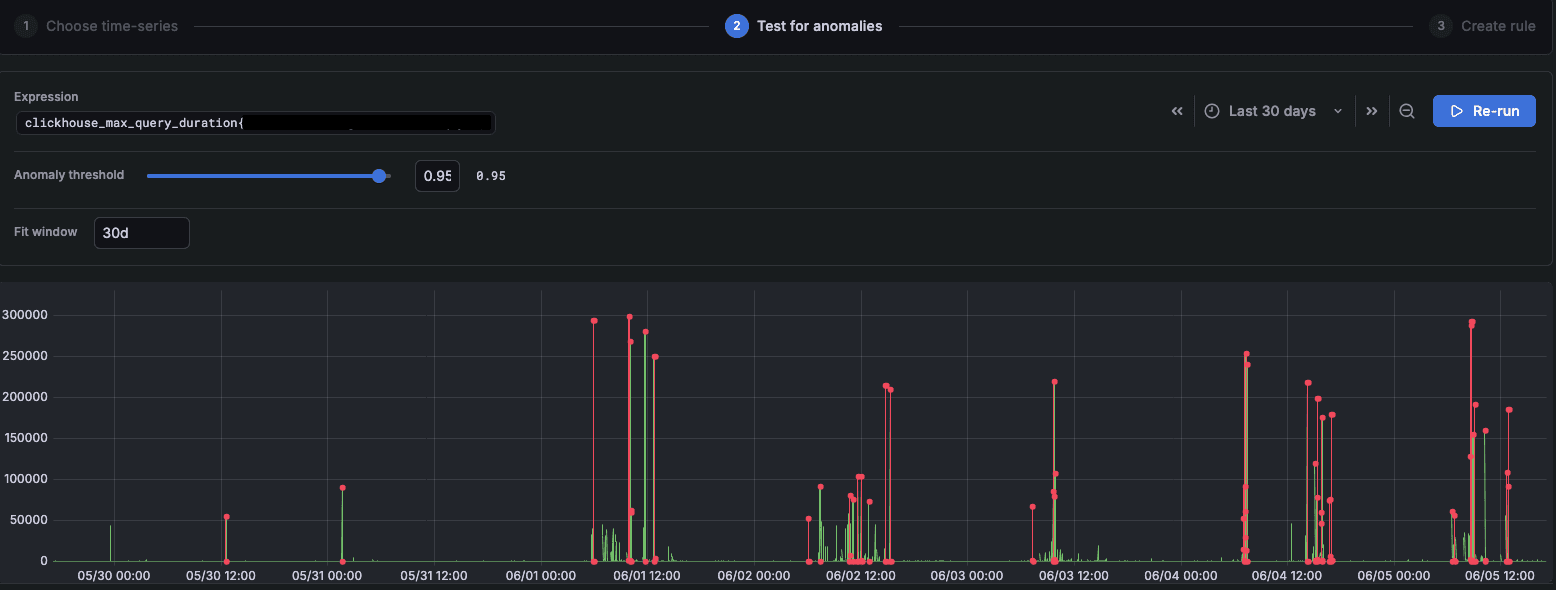
Step 2 — Test it before you commit (this is the part most tools skip)

Before saving anything, you run detection on your real historical data. The chart loads with red segments already overlaid — every window where the anomaly score exceeded your threshold, over the last 30 days.
You can tune two things interactively:
Anomaly threshold: Drag the slider, and the red segments update instantly. No re-query needed. Slide toward 1.0 for fewer, high-confidence flags. Slide toward 0.0 for broader coverage, catching more subtle drifts.
Fit window: How much history the model trains on. 30 days works for most metrics. Go wider (60–90 days) if your metric has monthly patterns. Go shorter (7–14 days) if your system's baseline recently changed (like after a big deployment, a traffic migration, anything that fundamentally shifted behaviour).
Here's the move that saves you the most time: scroll to a time window that includes a real incident you already know happened, and check that the model would have caught it. Takes two minutes. Eliminates most of the guesswork about where to set your threshold.
Some starting points if you're not sure where to begin:
| Metric type | Threshold | Fit window |
|---|---|---|
| Stable infrastructure (CPU, memory) | 0.85 – 0.90 | 30d |
| Bursty application metrics (request rate, errors) | 0.90 – 0.95 | 30d |
| Highly variable or spiky metrics | 0.95 – 0.98 | 60d – 90d |
| Post-deployment / fast-changing systems | 0.80 – 0.85 | 7d – 14d |
Step 3 — Save the rule
Once you're happy with what the model catches, save it as a named rule. From that point, it evaluates your metric every minute and writes results back as Prometheus metrics you can query immediately in Grafana:

Simplest to alert on — 0 or 1:
anomaly_flag{original_metric="request_rate", env="prod"} == 1
Continuous score — useful for dashboards showing how anomalous something is trending:
anomaly_score{original_metric="request_rate", env="prod"}
Both metrics carry all your original series labels. Wire anomaly_flag into your existing alert rules and you're done! Same alerting infrastructure, better signal.
The model retrains daily by default, so it stays current as your traffic patterns evolve.
💡 When things aren't quite right
Two ways this can go sideways, and both are fixable:
Too many flags
If things are getting flagged that aren't real incidents, then raise the threshold toward 0.95, or extend the fit window to 60–90 days so the model has more history to build a realistic picture of normal. You can also coarsen the fit step to 10m to smooth out short-lived spikes in training data.
Missing real incidents
If things are not getting caught, then lower the threshold toward 0.75, or shorten the fit window if your system's baseline changed significantly recently. Tighten the fit step to 1m if you want the model to form tighter bounds.
The Step 2 preview is your best tool for this. Drag the slider, look at what appears and disappears, and compare against incidents you remember. It's a visual process — much faster than trying to calculate the right number in your head.
💭 Back to that Tuesday morning
The request rate is at 280. Your threshold is set for 3 AM baselines. Nothing fired.
With anomaly detection running, the model trained on your last 30 days knows that 11 AM on a Tuesday normally sees 1,200 req/s. A reading of 280 scores a 0.97. The flag fires within a minute. You find out before the customer does.
That's the difference. Not smarter thresholds — a completely different way of deciding what "wrong" looks like.
✅️ Your Data. Your Choice
Everything described in this post — the forecasting model, the anomaly scores, the continuous monitoring rules — runs entirely on Gigapipe's infrastructure. Your data doesn't go anywhere.
The model trains on your data, scores your data, and the results come back to you. If your team has data governance requirements, compliance obligations, or you simply prefer that production data stays within your own perimeter, this is the right approach.
If that's not a constraint for you and you're more focused on getting the most powerful AI tooling at the lowest possible cost, that's a completely different conversation, and I'll cover it in the next post. 👀
📢🚨 Try it now!
Anomaly Detection is available on Gigapipe Cloud right now, at no additional cost.
If you're already ingesting Prometheus metrics into Gigapipe, there's nothing to set up on your side. Enable the plugin, pick a metric, validate against your history, and save a rule. The whole thing takes under ten minutes.
And if you want to talk through whether it fits your setup, reach out — we're always happy to do a quick call.
Get started with Gigapipe Cloud 🚀
Gigapipe is a polyglot managed observability platform built on open standards. Your metrics, your data — our infrastructure.